International Trade Report 3rd Quarter 2014
Tables and Graphs
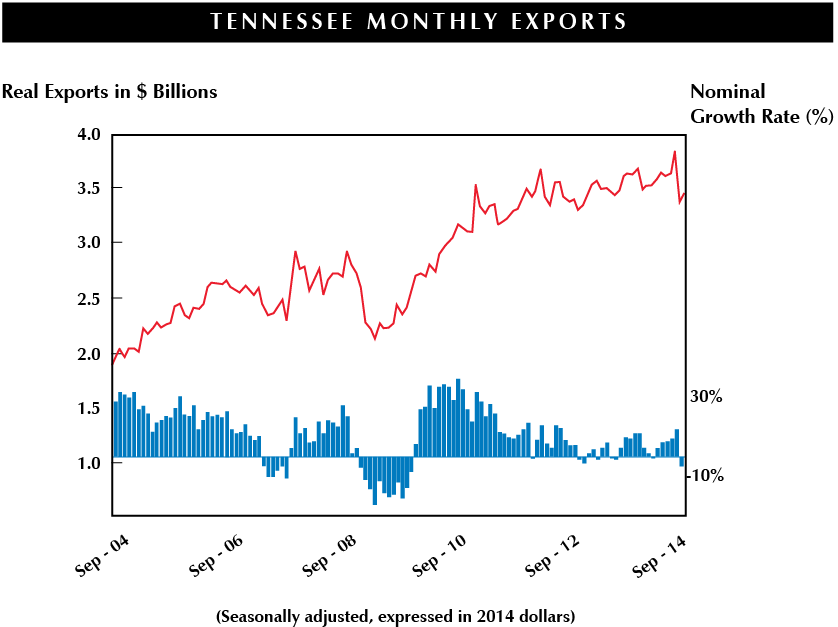
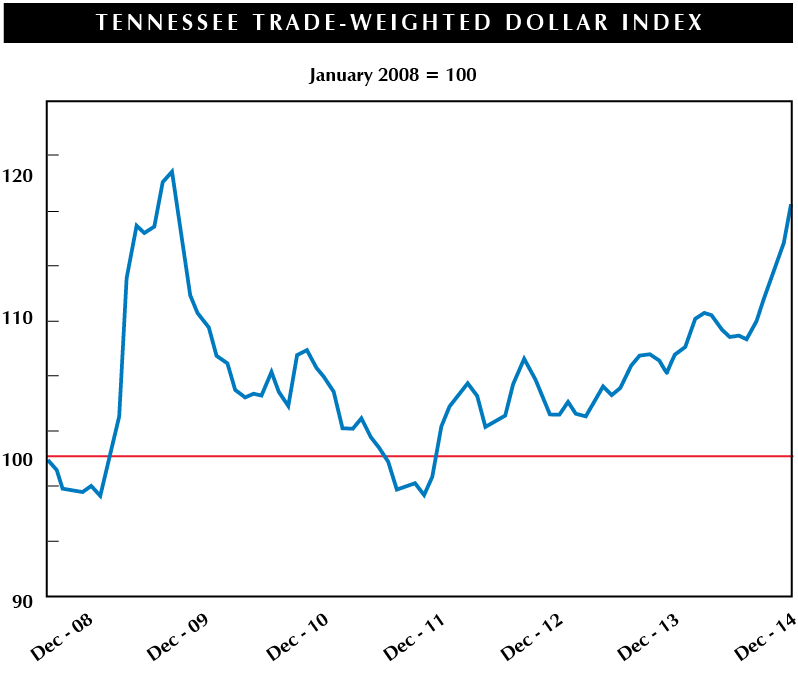
Tennessee exports rose modestly in the third quarter, to $8.24 billion. This was a gain of 4% from the third quarter of 2013, just about identical to the national gain of 4.2%. Unfortunately all of the gain was due to a very strong July. State exports actually fell in the latter two months of the quarter. Though not helped by the soaring dollar, the Tennessee slowdown was more due to continuing slow global economic growth combined with large losses in several export sectors.
The major loss was in cotton shipments. The value of the state's cotton exports fell by close to $100 million for the quarter ($225 million in the third quarter of 2013 but only $133 million in the 3rd quarter of 2014). The loss was global with Chinese exports off by half, Indonesia's more than half, and Turkey's by a full two-thirds. Most of the state's poorest-performing markets were its traditional large cotton markets. The Chinese cotton stockpile and resulting decision to cut back imports does not bode well for the near future. The other sizable slide occurred in the shipment of optical media (DVDs and such), which fell by nearly $60 million (to $44 million). These exports go overwhelmingly to Canada.
Though a few other commodities suffered significant reverses, including excavation equipment, nonwoven fabrics, cellulose, and tires, the large majority of Tennessee export industries were able to forge gains for the quarter, even if in many cases rather small ones.
The automotive industry continued to lead the gainers. A steep fall in truck and heavy SUV shipments was more than countered by a very large rise in car and light SUV exports. As a result, total vehicle exports rose from $533 million to $602 million. Canada accounted for the lion's share of those gains, though China, Korea, and Russia (!) also saw significant upticks in Tennessee vehicle shipments. The odd Russian figure is presumably due to Volkswagen and its Russian auto plant. Automotive engine exports were up around 20% (to $200 million). With the exception of automotive instruments, most other auto-related goods also posted positive numbers.
Medical equipment and medical-related exports maintained their pole position as the state's largest export industry, although it was not a particularly good quarter. While pharmaceuticals (up $22 million to $144 million), medicaments, orthopedic goods, and artificial joints made gains, there were losses almost everywhere else in the sector. Surgical catgut fared the worst, with its exports falling from $136 million to $104 million.
The electronics sector fared better. Computer-product and telephony exports were both up over 10%. Electrical equipment was similarly strong, with shipments rising nearly 50% (from $83 million to $123 million). Tennessee's other major export industries, chemicals, synthetic fibers, aircraft (and parts), and regulating/ diagnostic instruments, did not experience much change from a year earlier.
Globally, Tennessee continues to feel the effects of Europe's economic doldrums. State exports fell about 2% in the euro zone (to $965 million). The big decline in cotton exports meant in general a poor quarter in Asia. China, however, shrugged off the cotton losses. Thanks to a variety of industrial sectors, notably including automobiles, Tennessee's total exports to China were up 6% (to $617 million). South Korea grew as well. Japan was another story. State exports there declined nearly $100 million, making it the state's poorest-performing large market. About half of the loss was in the medical sector (explaining that industry's weak quarter). The other half was due to a large decline in photovoltaic-cell (solar panel) sales. Despite plenty of churn in South America, with exports to Chile dropping while those to Colombia soared, overall the continent barely moved. Tennessee shipments in the third quarter of 2013 were $564 million; in 2014 they were just $8 million more.
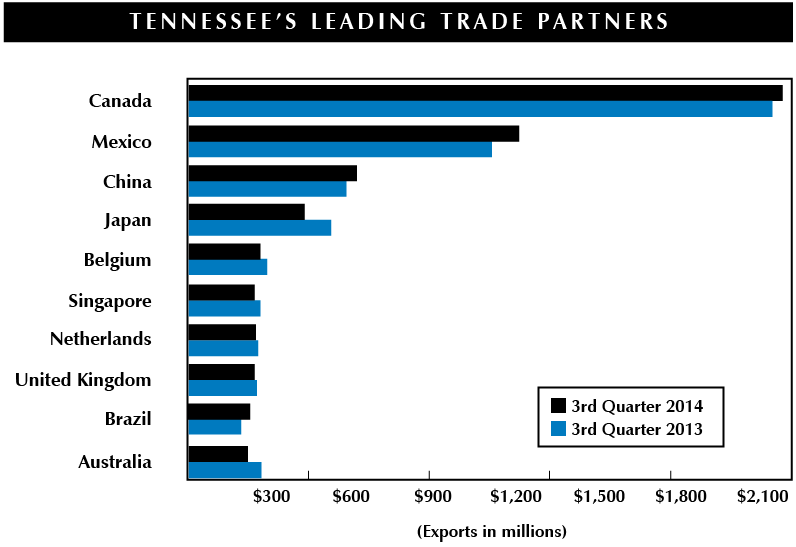
The NAFTA market, finally, was steady if not spectacular. Exports to Mexico rose $101 million for the quarter (to $1.208 billion), while those to Canada increased $29 million (to $2.145 billion). That Canadian performance is actually better than it looks, for this figure includes a drop of nearly $80 million in goods sent back for repair or other reasons not involving an original sale.
In sum, it could have been better, and it has been over the previous several quarters. But it could have been worse. State exports continue to eke out gains despite a sluggish world economy and a now-rising dollar. In such an environment it's hard to ask for too much more.
TENNESSEE'S LARGEST EXPORT SECTORS |
Value of Exports |
Change over Year |
Change over Quarter |
| Medical Equipment | $867,743,395 | -4.1% | -2.7% |
| Motor Vehicle Parts | $716,895,569 | 1.5% | 4.9% |
| Motor Vehicles | $639,042,371 | 10.8% | -12.6% |
| Computer Equipment | $534,677,414 | 7.1% | -6.0% |
| Basic Chemicals | $555,501,791 | -1.0% | -6.7% |
| Synthetic Fibers and Filament | $483,496,816 | 3.8% | 1.6% |
| Auto, Industrial, and Electromedical Instruments | $400,470,604 | 7.8% | 2.2% |
GREATEST EXPORT GROWTH AND DECLINE* |
Value of Exports | Growth % | Decline % |
GREATEST GROWTH |
|||
| Automobiles | $392,450,024 | 219.6 | |
| Heavy Coated Paperboard | $18,093,449 | 180.1 | |
| Flywheels and Pulleys | $14,200,098 | 118.7 | |
| Scanners, Magnetic/Optical Readers | $23,638,936 | 112.6 | |
| Miscellaneous Electrical Machinery | $29,967,187 | 102.6 | |
GREATEST DECLINE |
|||
| Otherwise Unclassified Computers | $9,791,548 | -63.8 | |
| Discs, Tapes, and Other Optical Media | $44,456,127 | -56.6 | |
| Ash Containing Precious Metals | $5,764,624 | -49.8 | |
| Trucks and Large SUVs | $220,283,774 | -46.4 | |
| Nonwovens between 70 and 150 g/m2 | $12,909,833 | -45.9 | |
*among Tennessee's top 100 exported goods
FASTEST-CHANGING DESTINATIONS* |
Value of Exports | Growth % | Decline % |
GREATEST GROWTH |
|||
| Jordan | $7,867,785 | 151.8 | |
| Norway | $10,889,593 | 94.5 | |
| Bahrain | $13,633,311 | 91.9 | |
| Russia | $82,340,338 | 89.4 | |
| Denmark | $8,949,966 | 78.2 | |
GREATEST DECLINE |
|||
| Luxembourg | $154,620 | -99.0 | |
| Honduras | $8,271,242 | -69.8 | |
| Indonesia | $38,245,652 | -38.6 | |
| Qatar | $14,946,3038 | -37.5 | |
| Turkey | $80,673,135 | -34.2 | |
*among countries averaging > $5m sales/quarter

