Tennessee's Auto-Related Exports: Growth & Geography 1st Quarter 2015
Tables and Graphs
A look at what is perhaps the state's largest export sector
The automotive industry has reshaped the Tennessee economy since its arrival in the 1980s. Over the past several decades, it has become perhaps the state's largest export sector, and it has been a major driver of Tennessee's significant export growth in this still new century. We say "perhaps" because measuring the true size of the automotive industry and its exports is fiendishly difficult. While the value of shipments of cars, trucks, and major auto body parts is well known, other automotive components are counted separately (e.g., tires or automotive lighting) or are buried within other industries (ball bearings, for example). Here we attempted to aggregate the exports of every automotive-related product that can be identified as such into one summary number. Even this number will be too low, because the foreign shipments of things like those automotive ball bearings simply can't be extracted from total commodity exports that include significant non-auto-related production.
Using this aggregation of auto-related exports allows us to examine the international growth of this industry in Tennessee. We can also map the locations of exporters to see where it has the largest impact in the state.
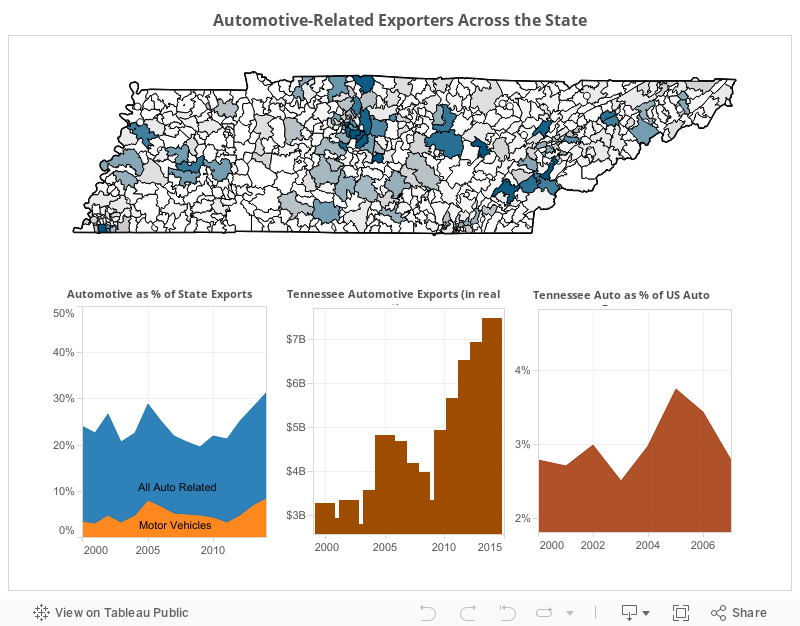
In 2014, cars valued at $2.8 billion were shipped out of Tennessee, but total auto-related exports stood at just under $7.5 billion. This means that only a bit more than one-third of all the automotive-related exports are the vehicles themselves. Around two-thirds are various parts that go into them. Both sectors have grown dramatically. The state exported about $400 million of vehicles at the start of the century and about $2 billion of components. Of course these numbers are unduly modest since they don't account for the intervening inflation. Valued in today's "real" dollars, they would stand at $565 million for vehicles and $2.5 billion for components. From this we can see that the export growth has been very substantial in recent years (even when including the huge crash following the global financial crisis in 2008). We also note that the ratio of exported vehicles to components has risen quite a bit over these years. Large expansions at Nissan plus the arrival of Volkswagen explain that change.
In 2014, cars valued at $2.8 billion were shipped out of Tennessee, but total auto-related exports stood at just under $7.5 billion.
The growth in exports of motor vehicles has far outpaced overall Tennessee export growth. As a result, cars accounted for 8.5 percent of all state exports in 2014 vs. just 3.6 percent in 2000. Much of this growth is rather recent. The value of the state's vehicle exports has virtually doubled in the past two years. Non-vehicle automotive exports, on the other hand, though they have grown robustly, actually have fallen as a percentage of total state exports (from 17 percent in 2000 to 14 percent in 2014). However, this hides a very rapid ascent in the past few years. After falling to barely over 10 percent of all state exports in 2009, automotive component exports have since increased their share of Tennessee exports by almost one-third.
Just as Tennessee's automotive sector is expanding its share of state exports, so it is expanding its share of total US automotive-related exports. Tennessee is today the seventh-ranked state for car exports, accounting for about 4.5 percent of the value of American auto exports. In 2000 it ranked 11th with just 2.4 percent. Tennessee also ranks among the top 10 exporting states in 12 other automotive export categories (six-digit h.s. code). Its portion of total American automotive-relative exports has grown by over 50 percent since 2000 (from 2.8 to 4.3 percent of US exports in this sector).
These few statistics are enough to indicate how important the industry is to the state and how successful it has been. This leads us to the question of where it is located. Where do we find this industry in Tennessee? The accompanying map reveals some clear patterns. We see two concentric circles, of decreasing density, around Nashville, which by number of establishments is clearly the center of Tennessee auto-related exports.* However, we see a sizable presence across much of the state. In particular, there are significant numbers of exporters in the corridor from south of Knoxville up to the Tri-Cities and a surprising number in the Jackson area. The concentration of zip codes around Memphis and especially Chattanooga makes it harder to spot how many exporters can be found in both, but hovering over the map ought to convince you that both of these communities have a sizable number of auto exporters as well.
The ability to export is usually considered a clear sign of economic competitiveness. The few charts and graphs here should convince us that Tennessee is heavily invested in the automotive industry, very broadly defined, and that this sector is indeed quite competitive. Recent performance indicates that both patterns should continue for some time.
Tennessee is today the seventh-ranked state for car exports, accounting for about 4.5 percent of the value of American auto exports.
*For visual purposes, establishments in zip codes that are completely enveloped by other zip codes are assigned to the surrounding zip. There are about 90 zip codes in Tennessee like this, mostly in urban areas.

