International Trade Report 4th Quarter 2014
Tables and Graphs
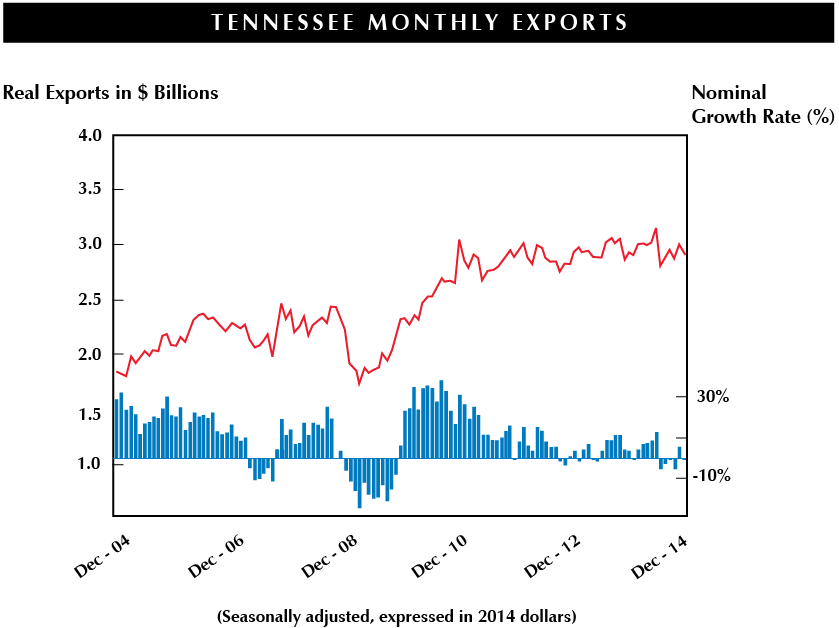
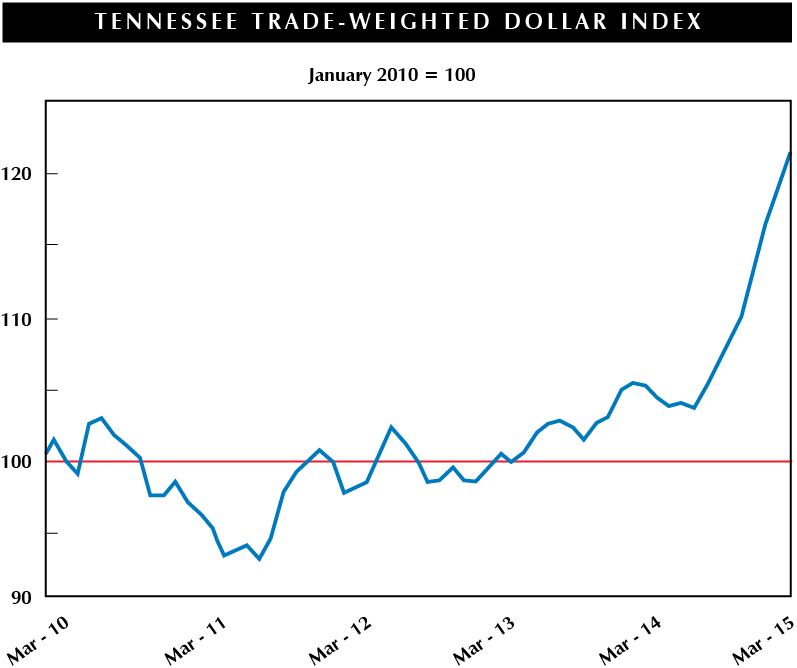
State exports were essentially flat for the fourth quarter, growing a miniscule 0.1% to $8.233 billion, pretty much in line with the national experience. American exports grew just under 1% for the quarter. For the past two years, Tennessee exports forged ahead primarily because of robust gains in automotive shipments. This slowed sharply in the third quarter and virtually came to a halt in the fourth. The end of these gains revealed the anemic export growth of most other state (and national) industries. Without doubt the strengthening dollar was a factor. But because the dollar's strength was not yet fully incorporated into fourth-quarter sales and purchase orders, we can't blame all of the slowdown on its rise. The continuing sluggish global economy seems the major problem facing state exporters.
The biggest change for the quarter was the slowdown in the automotive sector. The continuation of the rotation from trucks and large SUVs to smaller vehicles was evident. Exports of the former dropped substantially ($424 million to $301 million), while the latter increased sizably ($258 million to $307 million). This netted to a loss of about $24 million in vehicle shipments. Motor vehicle part exports performed better, gaining $57 million, which led the entire sector to a combined 2% growth for the quarter (to $1.16 billion). While shipments within NAFTA held up (Canada was up over 20%), there were significant declines almost everywhere else. Automotive industry exports fell about $20 million in the E.U., almost $30 to the Middle East, $33 million to Latin America, and $46 million to Australia. The only two non-North American markets that performed well were Korea and Russia. The large recent gain in sales to Korea (from $16 million to $43 million in the third quarter) suggests the positive impact of the 2012 free trade agreement with that country.
It was inevitable the automotive export spurt would slow at some point. From mid-2012, the state's car and SUV exports have risen from $136 million to $675 million. We could not reasonably expect that remarkable performance to continue without cease. For Tennessee exports to continue to grow, other industries, sooner or later, would have to contribute.
The biggest change for the quarter was the slowdown in the automotive sector.
Even with its slight 2% growth, the automotive industry still fared best among the state's large export sectors. Though medicament shipments were solid, the medical instrument sector, the state's other largest export sector, declined from $568 million to $511 million. Medical exports to Japan dropped by a quarter, while those to the E.U. were off 105. Several related industries, including medical needles and surgical catgut, also experienced significant losses.
No sector was more volatile than aircraft (and parts). But the bottom line is that its foreign shipments were down significantly, making it the state's poorest-performing major export industry. Large sales in Mexico, the U.K., and Japan could not make up for even larger declines in Turkey, France, Colombia, and Egypt. As a result industry exports fell nearly $90 million for the quarter.
Among the state's other large export sectors, the computer industry barely budged. It gained $4 million for the quarter, as growing laptop shipments barely exceeded falling desktop exports. The plastics industry was off slightly, due to a steep fall in cellulose acetate shipments. Cotton continued to shrink (from $115 million to $75 million, pun intended!). Mowers and excavation equipment sales both fell by nearly half. And aluminum shipments declined by around one-third (to $55 million). One large product alone could claim to have had a pretty good quarter, internal combustion engines (and their parts). Its combined exports rose from $343 million to $431 million, a gain of 54%.
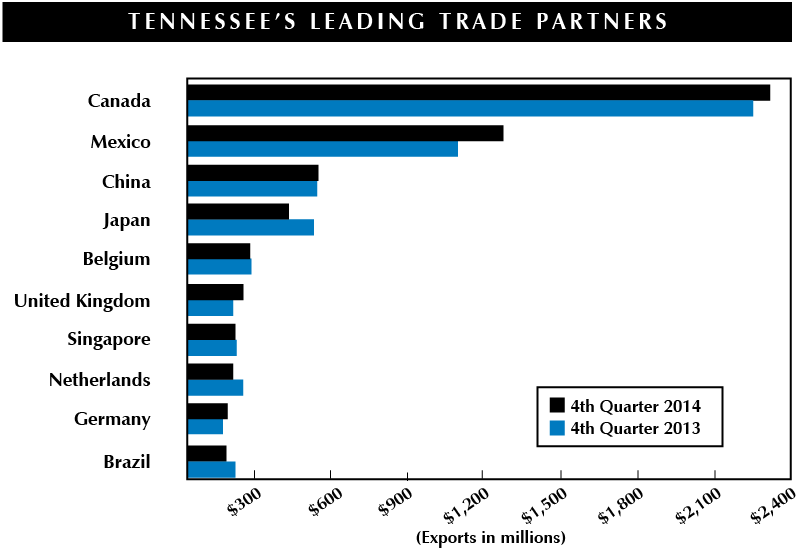
Geographically, it was pretty bleak outside of North America. While exports to Canada and Mexico were up about $200 million, exports elsewhere were down about equally. Mexico did particularly well, mainly due to a huge increase in laptop shipments, though engines and kraft paper also contributed. But state exporters saw lower numbers in every other global region except the relatively small markets of South Asia (resulting from large aircraft sales to Pakistan) and sub-Saharan Africa (aircraft purchases again). In East Asia, exports to China grew a modest 2%, and those to Korea a solid 27%, but the gains were drowned by a very large decline in Japan. A fall in car sales and aluminum shipments led the Middle East market to a 10% decline. The Eurozone dropped slightly, from one billion dollars in the fourth quarter of 2013 to $978 million in the fourth quarter last year, though exports to the U.K. managed to buck the trend. With exports to Brazil and Colombia both down markedly, shipments to South America also fell by 10% (to $505 million). In this context, the state's performance in Southeast Asia, where exports fell by "only" $15 million, almost looks good. However, the sad truth is that in Southeast Asia cotton exports had fallen so much earlier in the year there simply wasn't much further for things to fall in this textile-intensive region.
Early 2015 reports suggest the picture is not changing. Tennessee's foreign shipments are hardly crashing, but growth remains difficult. Based on early returns, the year may turn out to be a tough slog for state exporters.
TENNESSEE'S LARGEST EXPORT SECTORS |
Value of Exports |
Change over Year |
Change over Quarter |
| Medical Equipment | $803,832,433 | -9.1% | -7.4% |
| Motor Vehicle Parts | $747,556,309 | 5.0% | 4.3% |
| Motor Vehicles | $680,958,142 | -3.4% | 6.6% |
| Computer Equipment | $602,500,295 | 3.0% | 8.5% |
| Basic Chemicals | $520,000,204 | -1.2% | -2.7% |
| Synthetic Fibers and Filament | $432,350,901 | 0.6% | -10.6% |
| Auto, Industrial, and Electromedical Instruments | $424,434,440 | 3.2% | 6.0% |
GREATEST EXPORT GROWTH AND DECLINE* |
Value of Exports | Growth % | Decline % |
GREATEST GROWTH |
|||
| Turbojets with Thrust > 25kN | $11,534,907 | 1,086.8 | |
| Semi-Chemical Fluting Paper | $23,815,526 | 419.1 | |
| Passenger Cars | $60,992,911 | 290.5 | |
| Misc. Instruments and Measuring Apparatus | $13,678,567 | 168.0 | |
| Precious Metal Waste and Scrap | $61,088,614 | 156.4 | |
GREATEST DECLINE |
|||
| Lawn Mowers | $9,129,743 | -48.3 | |
| Nonwovens between 25 and 70 g/m2 | $8,452,211 | -42.6 | |
| Automotive Regulating Instruments | $25,179,630 | -40.0 | |
| Cotton | $74,984,364 | -35.0 | |
| Otherwise Unclassified Computers | $59,653,158 | -33.9 | |
*among Tennessee's top 100 exported goods
FASTEST-CHANGING DESTINATIONS* |
Value of Exports | Growth % | Decline % |
GREATEST GROWTH |
|||
| Pakistan | $34,636,975 | 482.6 | |
| Jordan | $9,898,479 | 210.7 | |
| Russia | $96,413,246 | 111.6 | |
| Greece | $5,896,905 | 109.7 | |
| Trinidad and Tobago | $12,651,612 | 86.3 | |
GREATEST DECLINE |
|||
| Luxembourg | $176,327 | -99.3 | |
| Honduras | $10,788,415 | -61.7 | |
| Turkey | $40,160,275 | -61.0 | |
| Egypt | $15,483,998 | -54.8 | |
| Saudi Arabia | $59,851,435 | -44.8 | |

